
Mapping the Invisible
Merriam-Webster defines a map as "a diagram or other visual representation that shows the relative position of the parts of something". Traditional maps diagram the world around us with locations and roads identified. But what about non-traditional maps. How do you map something that you cannot see? What kinds of intangible ideas or concepts could be reimagined as a map?
A Day in the Life uses a unique biological method to map the average stress levels, frequencies, and moods of Associated Students of SFSU student employees at major buildings on campus. The maps are based on a 1-5 scale with N/A as an option for buildings not regularly visited.
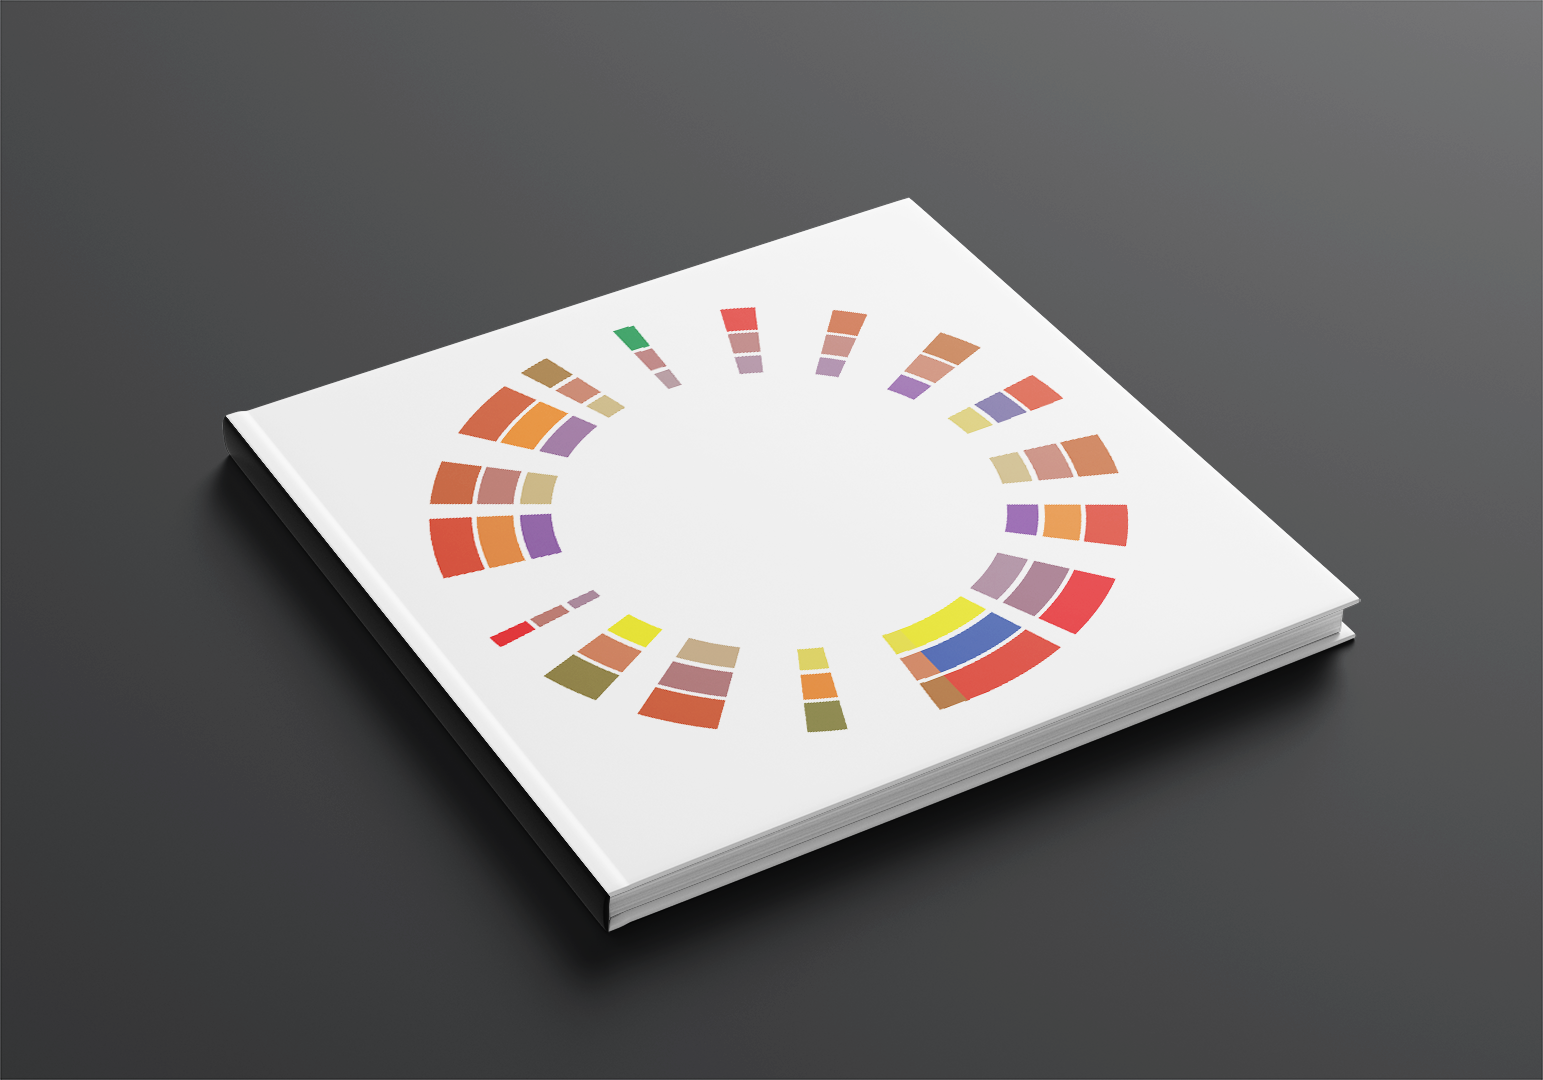
Booklet front cover featuring the map showing all the data collected
Scientific Inspiration
Before I could decide what I wanted to map, I first searched what other types of maps existed. Most of the non-traditional maps I found were mind maps or frequencies maps. However, I wanted to explore beyond what was to be expected. Being a lover of science growing up, I recalled learning about plasmid mapping. Plasmids are small circular DNA molecules used as vectors capable of cloning.

Plasmid map example showing various rings and sector widths. Original Art by Sandra Culliton.
Gathering the Invisible
At the time, I was working at Associated Students as a student employee, and I realized surveying coworkers would be the best way to get reliable, varying data. I decided to survey them on the following categories: stress levels, frequencies, and moods, relative to what building they were in on campus. After surveying 38 student employees, the data was divided into the different colleges of SFSU that each employee was a part of.
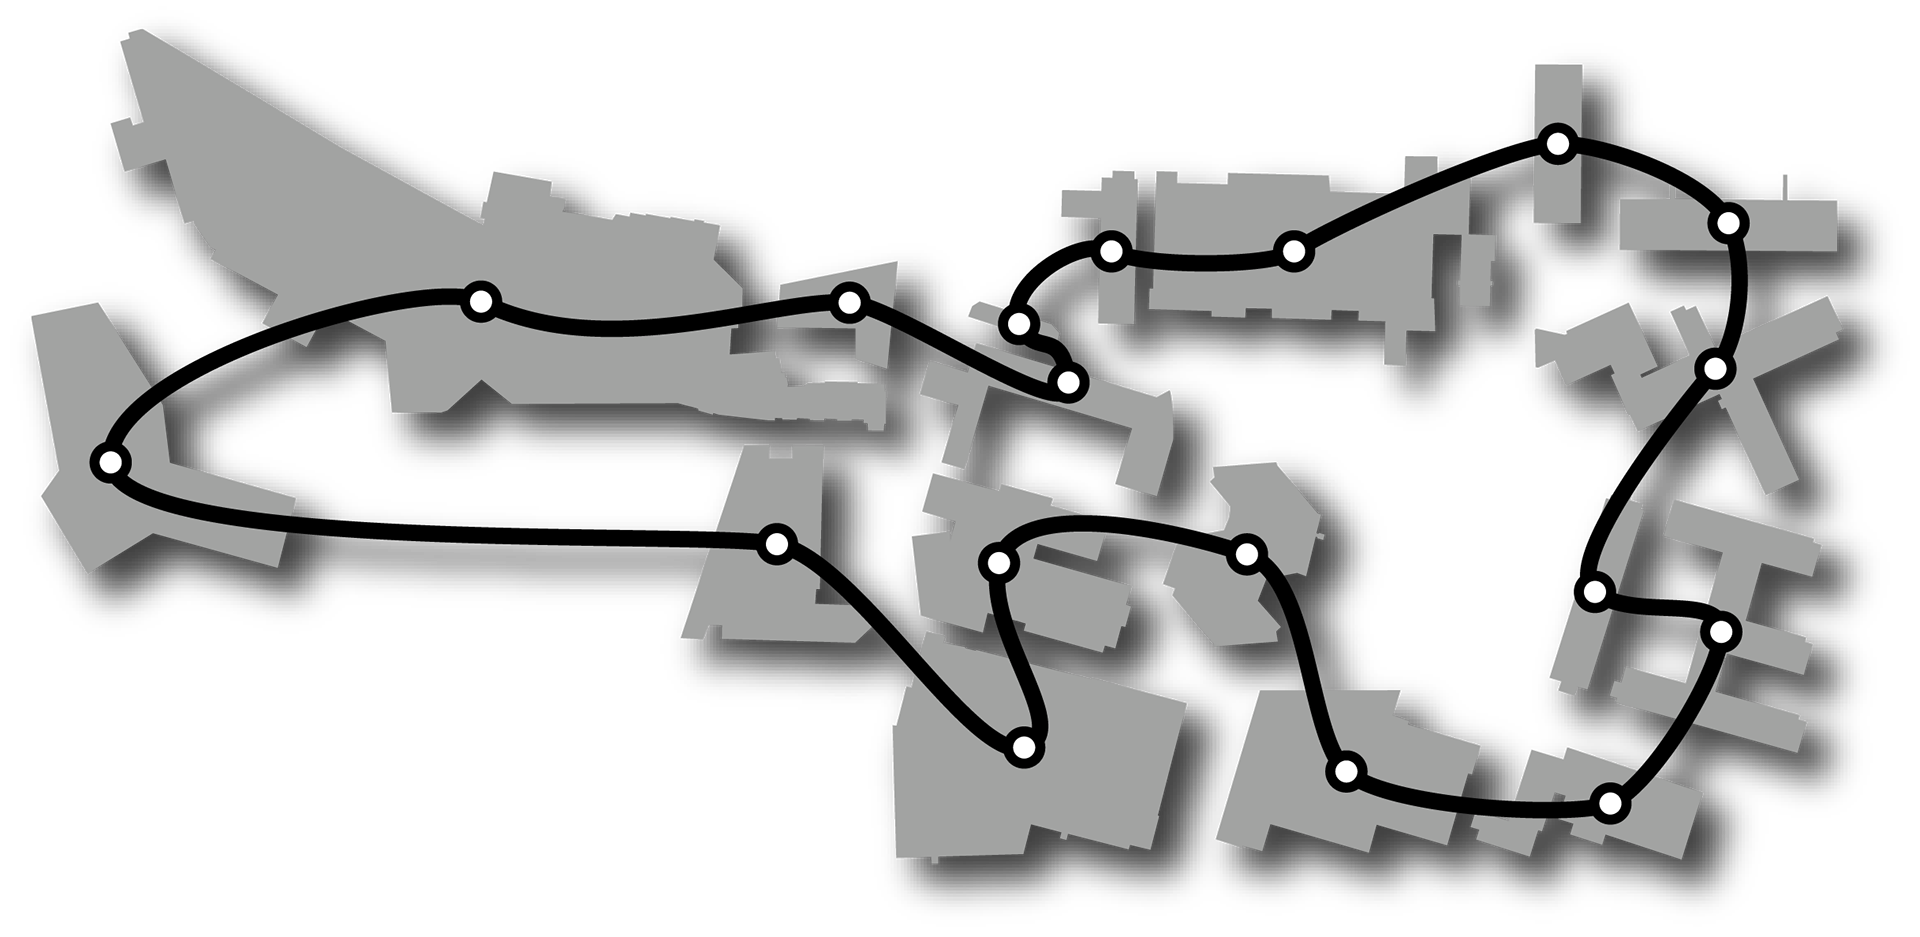
Vectorized top view of SFSU campus map with path followed.
Mapping My Coworkers
Each “map” illustrates the invisible qualities each person experiences, with each ring, outer, middle, and inner, representing stress levels, frequencies, and moods, respectively. Each sector represents a major building on the SFSU campus, while the width of each sector represents the percentage of student employees that regularly going to those locations. The color ranges of the 1-5 scales are based on the three pairs of complementary colors: green-red, orange-blue, and purple-yellow.
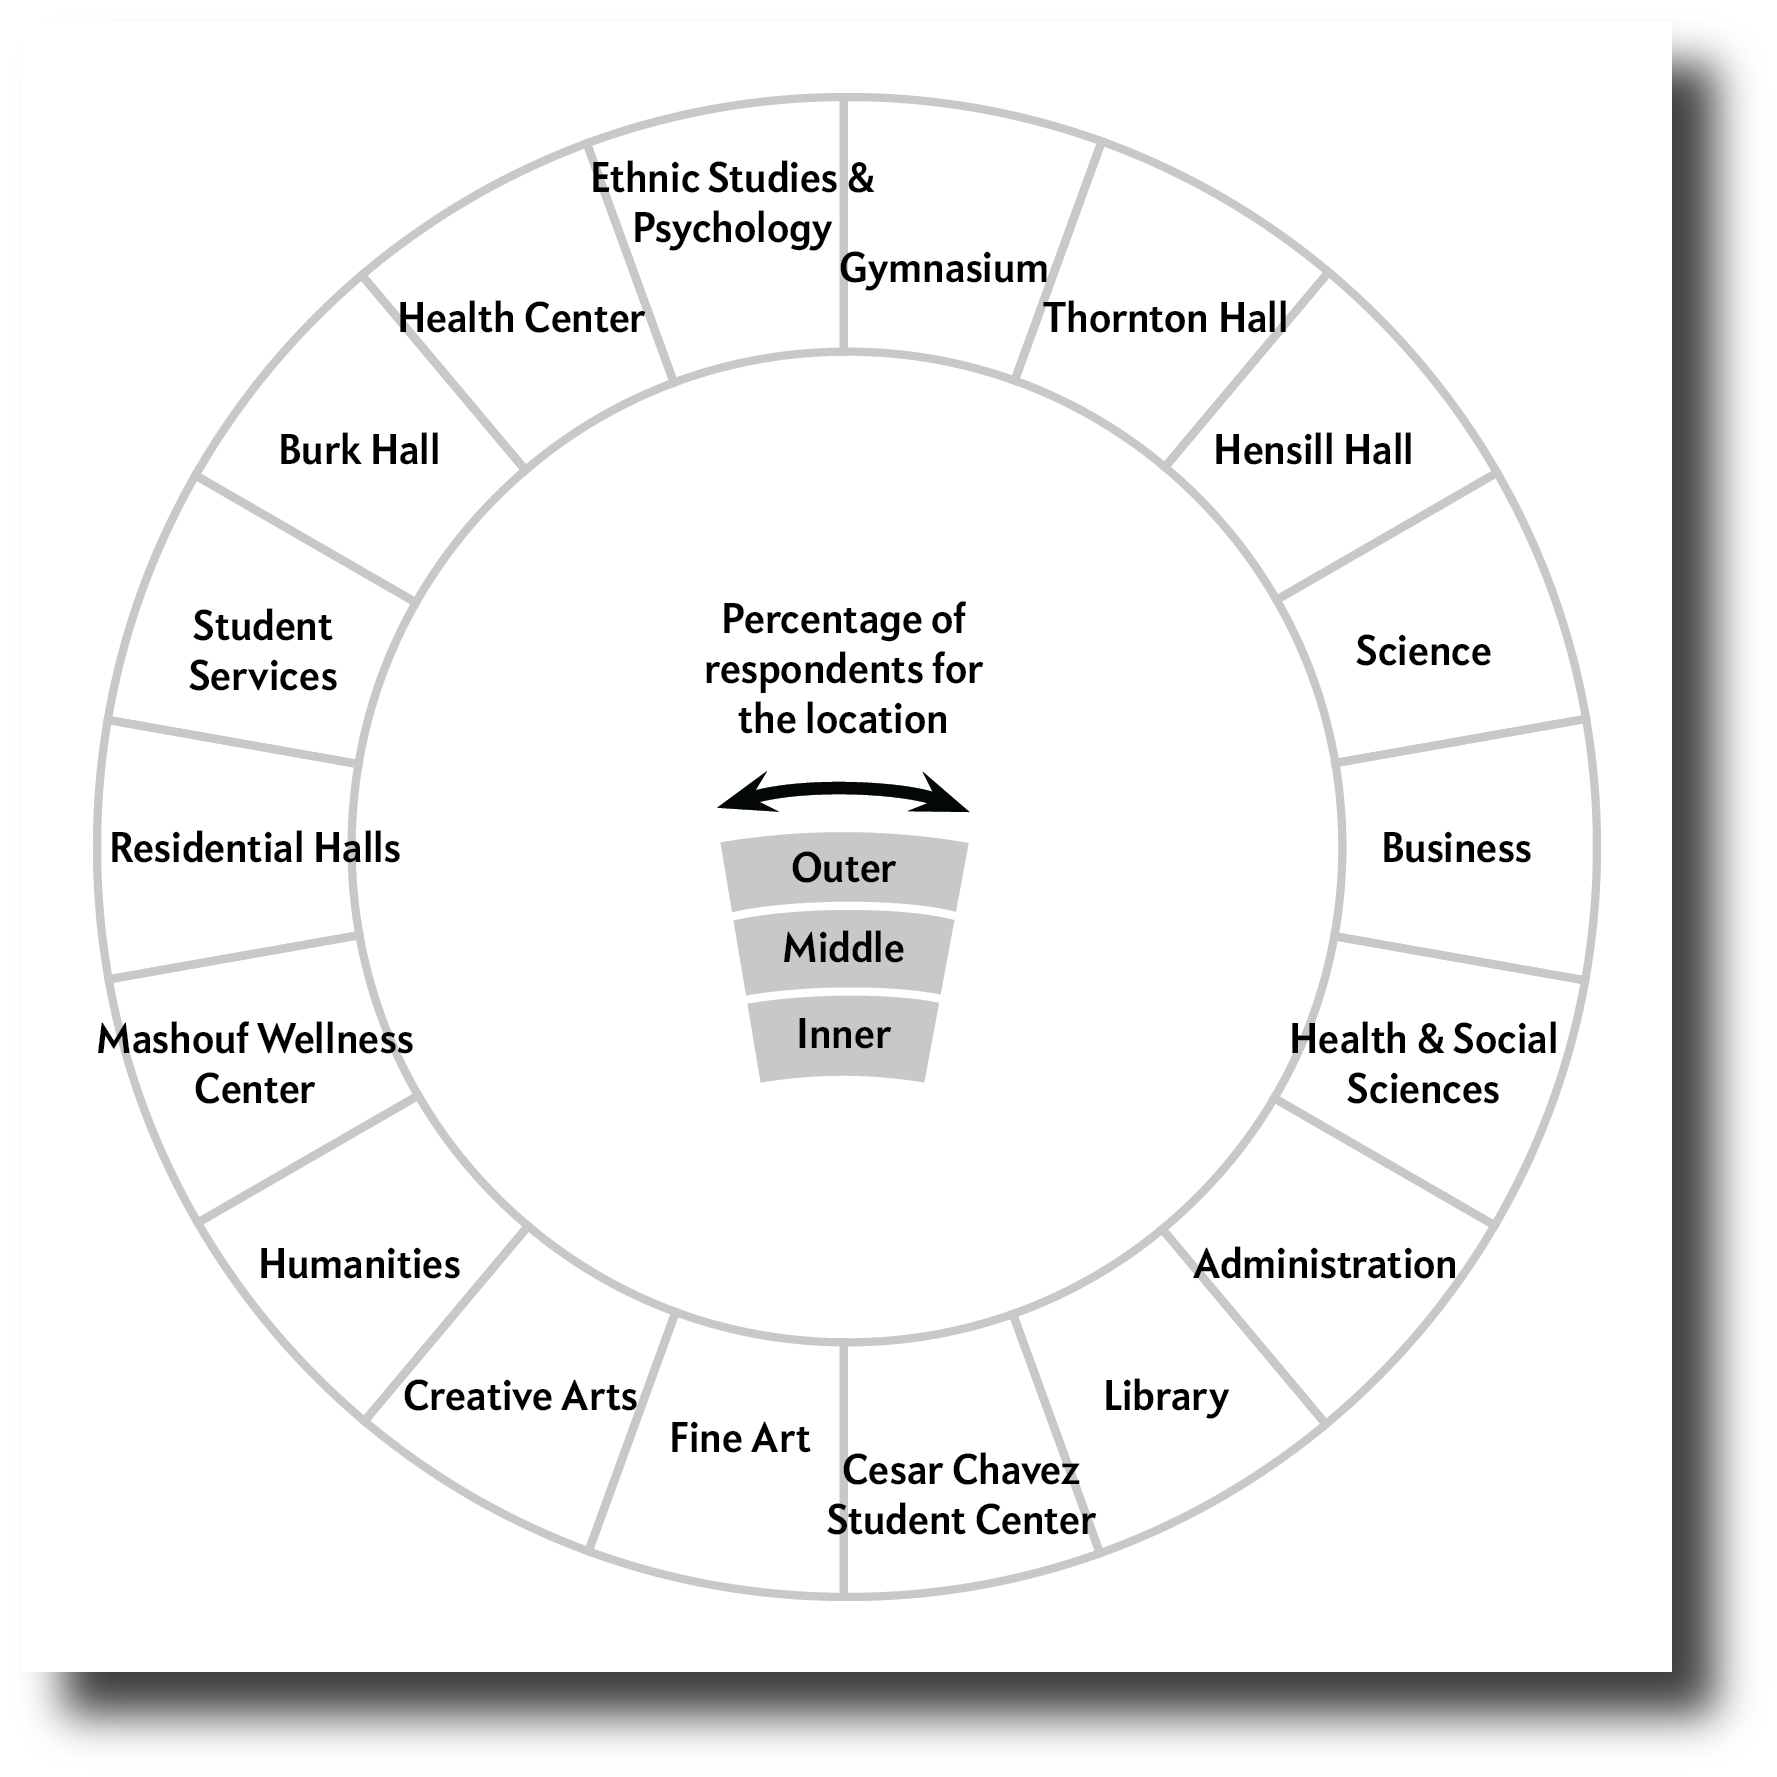
Transferable key used as guide for each page of book based on campus map.
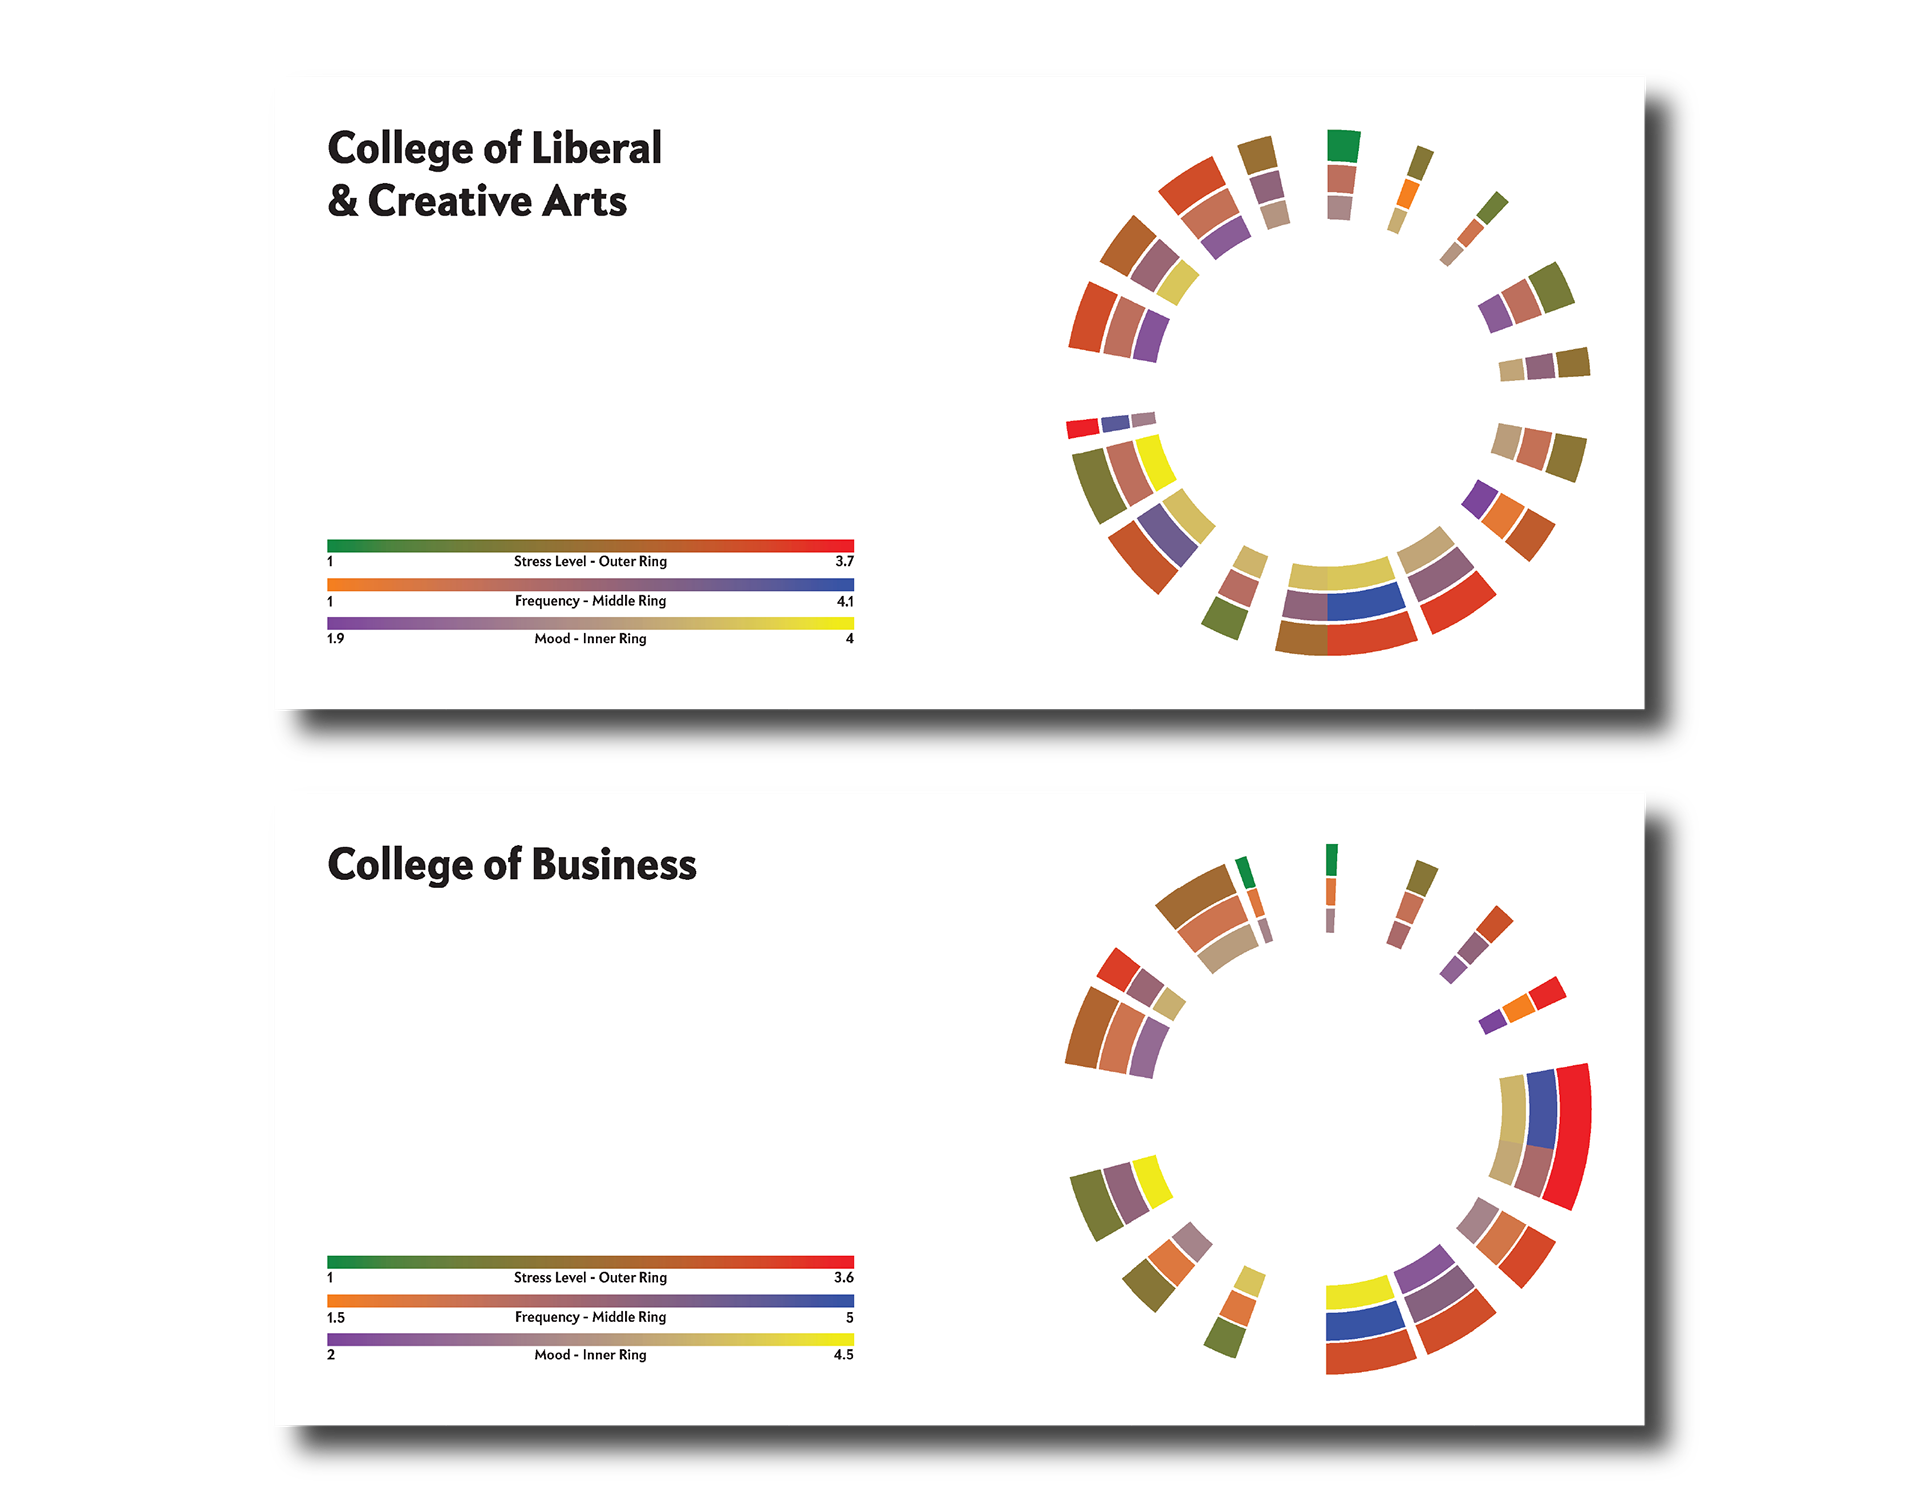
Example pages of maps based on respondents from respective colleges.
I Read the News Today, Oh Boy
The final design includes both a booklet and a poster. The booklet shows a more descriptive version of the maps, including scale ranges and a transferrable key communicating the different rings, sectors' names and widths. The poster shows all the different maps created in an abstract form, similar to that of the inspiration I had found.
Even with a small pool of respondents, it was interesting to see how many student employees were from each college as well as their relative stress levels going to their classes. It was fun to challenge what is traditional and be able to use a scientific method of mapping to represent a subjective concept.
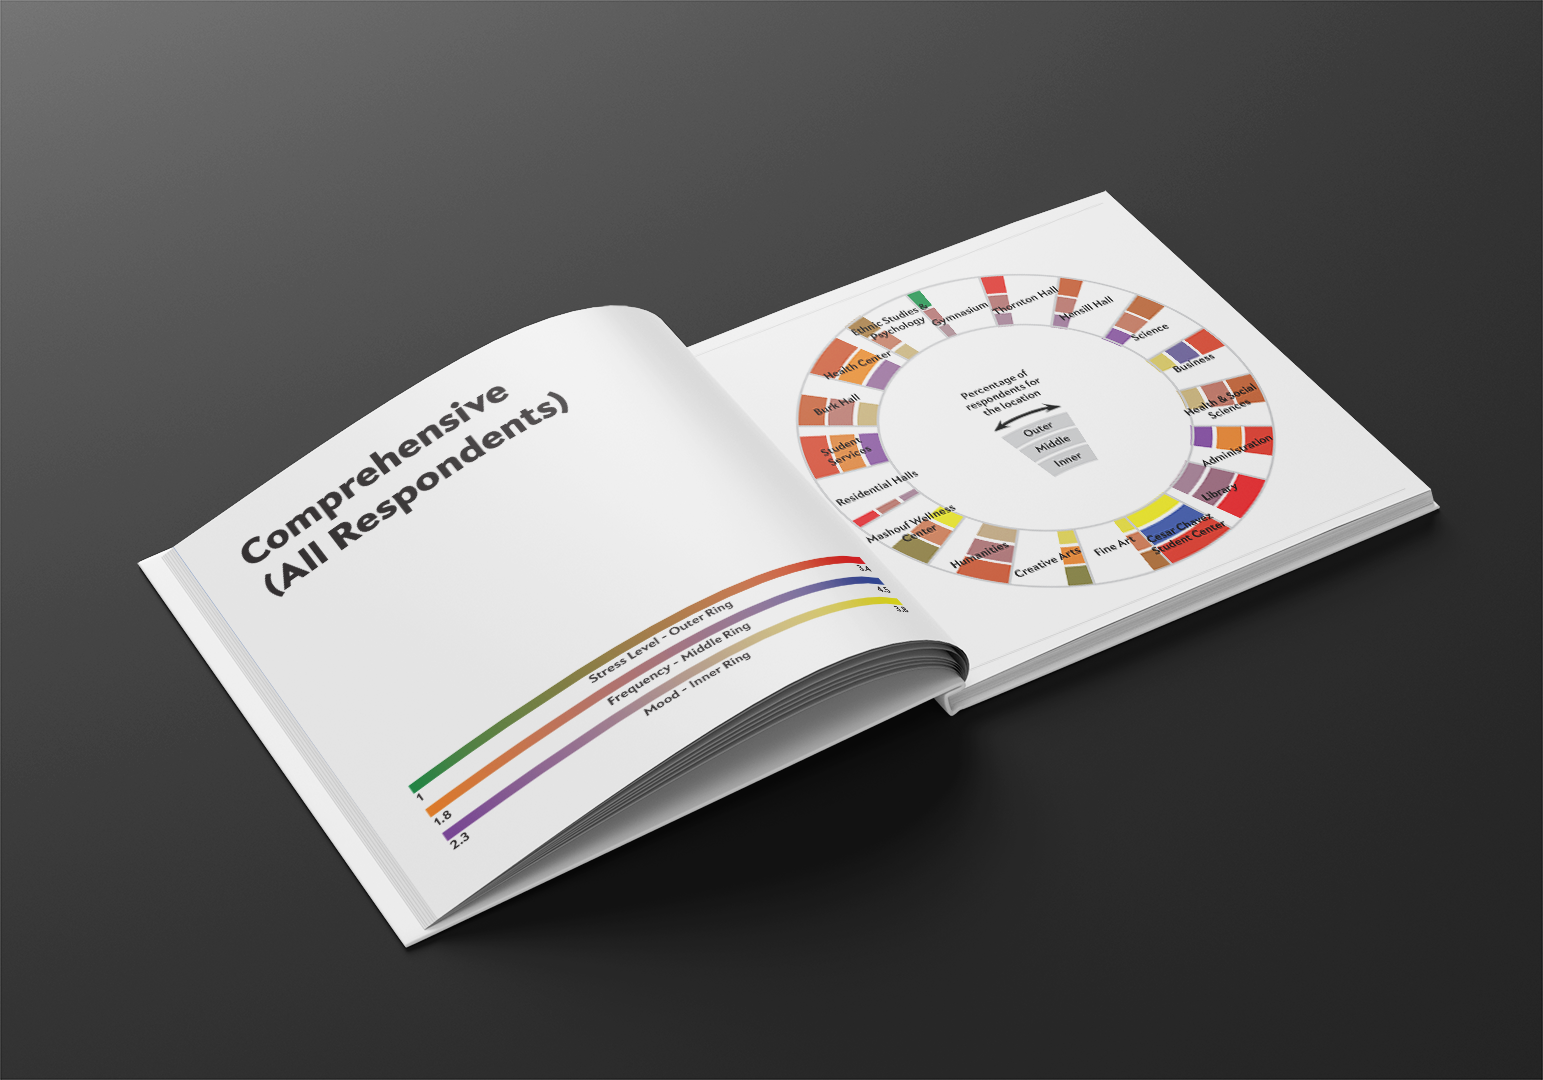
Book spread for map all respondents with designated color scales and transferable key overlaid on map.
Transferrable key in use.

A Day in the Life poster: (from left to right) Enlarged map - All respondents. Row 1 - College of Business, Graduate College of Education, College of Ethnic Studies. Row 2 - College of Health & Social Science, College of Liberal & Creative Arts, College of Science & Engineering.